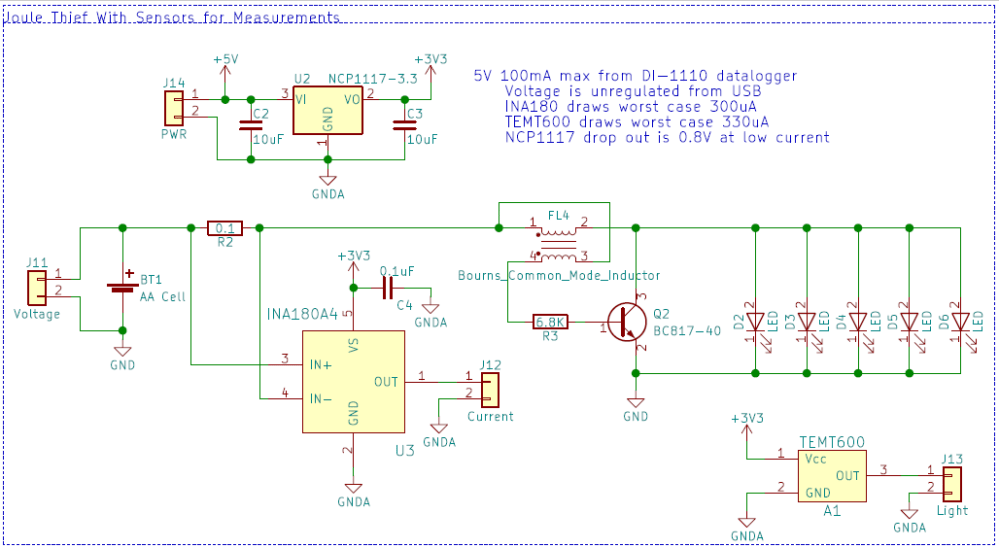
I put together the following circuit to measure battery voltage, current, and light output from a Multi-LED joule thief circuit. The PCB was designed in KiCAD so that it could be etched on a single sided PCB board using UV sensitive photoresist and ferric chloride.
| Description | Part Number | Quantity |
|---|---|---|
| 2 Line Common Mode Choke | SRF4532-510Y | 1 |
| Cool While 6500K LED | MP-2016-1100-65-70 | 5* |
| NPN Transistor | BC817-25-TP | 1 |
| 6.8K 0805 Resistor | 1 | |
| AA Battery Clip | BK-53 | 2 |
| Current Sense Amplifier | INA180A4IDBVT | 1 |
| 0.1Ω Current Shunt | RUT2012FR100CS | 1 |
| Ambient Light Sensor Breakout | TEMT6000 | 1 |
| 3.3V LDO Voltage Regulator | NCP1117DT33G | 1 |
| 10uF 0805 Ceramic Capacitor | 2 |
*Multi-LED Joule Thief V2 uses 6 LEDs so battery life may be slightly different

The circuit was connected to a DI-1110 USB data logger capable of up to 160 kHz over 8 channels. For the initial measurement only 3 channels were used at 10 Hz per channel. The DI-1110 is USB powered with a 5 volt power output capable of providing up to 100mA. This was used to power the ambient light sensor and current sense amplifier. Measuring the 5V from the DI-1110 reveals that it is not well regulated and will fluctuate based on the host PC and USB load. The 3.3V LDO voltage regulator was used to provide a well regulated voltage to power the measurement circuitry.

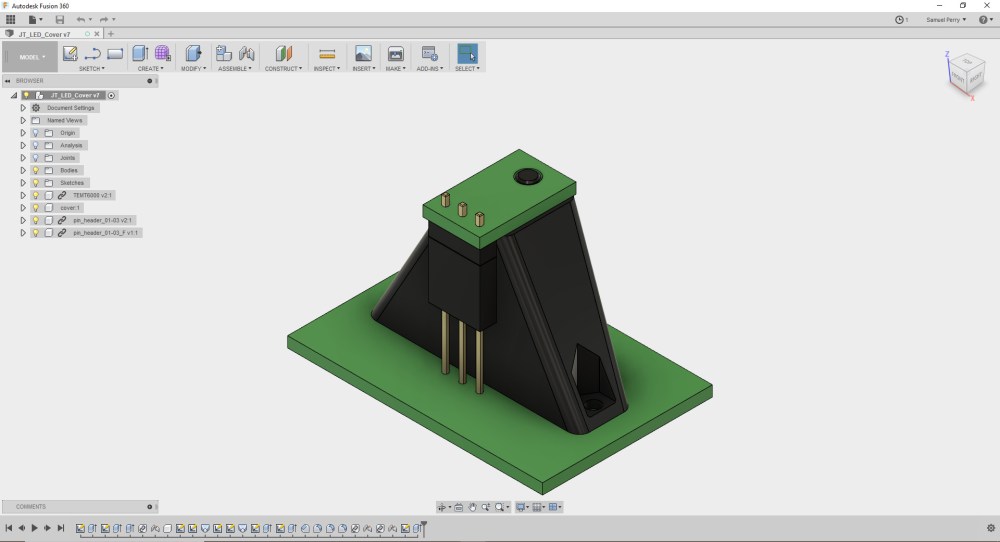
To prevent the light sensor from picking up external ambient light a cover was 3D printed and placed over the light sensor and LEDs.
The data logger was setup and the recording was started before a fresh AA battery was placed into the circuit. The joule thief was then left untouched until it was noticed that the LEDs were not emitting light. Below is a screen shot of the data collected.
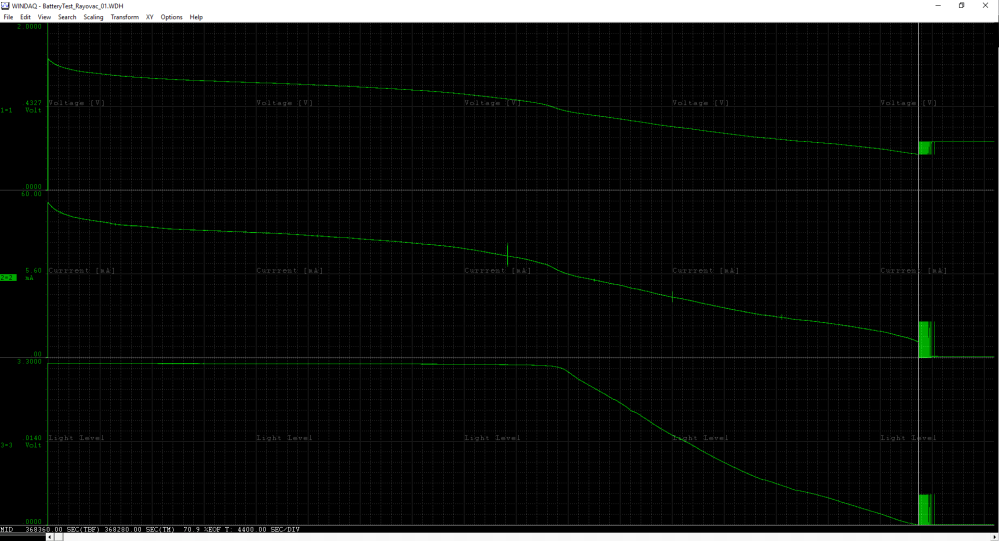
The battery lasted for 368,280 seconds or 102.3 hours. You can see that I placed the data playback cursor in the screenshot above before the oscillations, I do not count the ending oscillations as part of the battery life. Let’s look first at one of the spikes visible in the center of the screen on the current trace.

As you can see in the above screenshot when the battery voltage had reached about 1.09V the current experiences a brief moment of oscillation lasting about 156 seconds. Wanting to make sure this was the joule thief circuit and not external noise or an abnormally I ran the test again with a new AA battery and this time upped the sample rate to 1 kHz per channel.

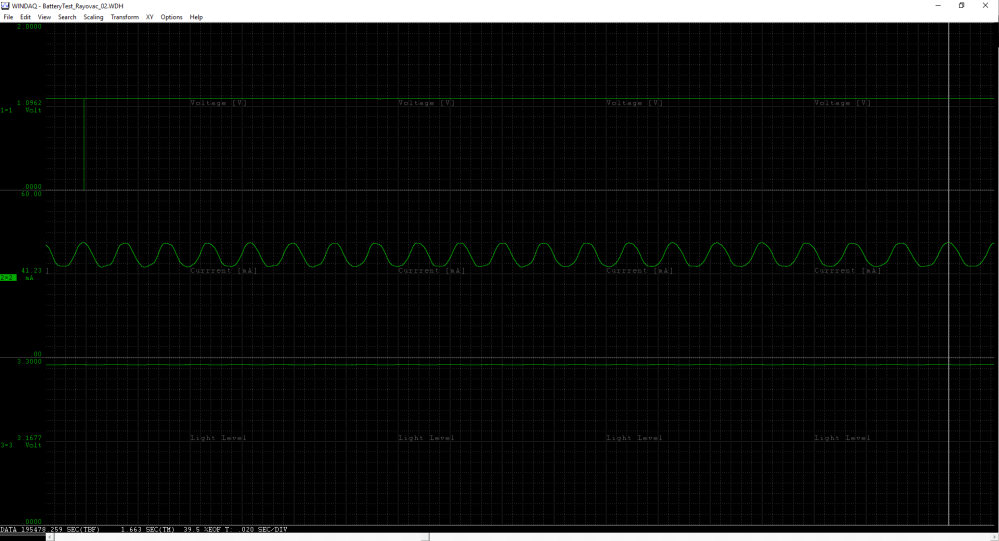
Again the same oscillation of the current occured at a battery voltage of about 1.09V but this time for over 2500 seconds, I have no explanation for the longer oscillation time. Since I was sampling at a higher frequency we can zoom in further and measure the oscillation frequency. There are 20 cycles over a 1.663 second time span for a frequency of 12.03 Hz. The current is about 8.5mA pk-pk at the maximum oscillation point.
What if we zoom into the battery voltage and light level waveforms, is there any oscillations there?

I can’t see any obvious oscillation of the battery voltage but look at the light level. I was concerned that the oscillations of the current was caused by something I overlooked while setting up the current sense amplifier or some other error in my measurement but I am slightly more confident in the measurements setup since the oscillations occur in both the current and light measurements. I will have to look deeper into these oscillations in the future.
Now let’s look at the large oscillations at the end of the data recording. I will return to the 10 Hz sampled data and zoom in a little closer, what is going on there?
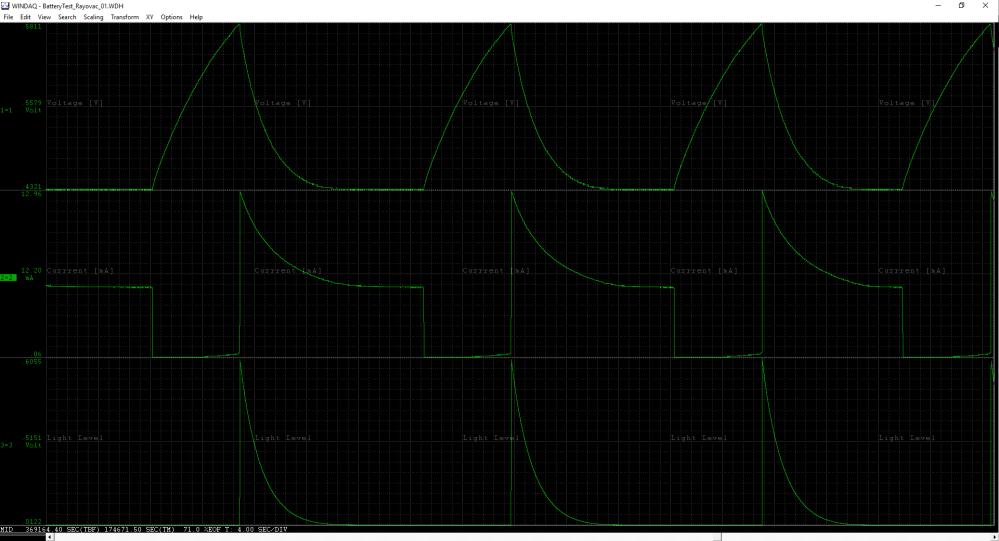
The battery voltage is swinging between 0.55V and 0.43V. In a previous Joule Thief Measurements article I experimented with changing the base resistor value from 1K to 6.8K. During that experiment I measured the turn on and turn off voltage of the joule thief circuit I had built up on the breadboard. That is what I am inadvertently measuring here. This joule thief circuit turns off at a voltage of about 0.43V at which point the battery starts to recover and the battery voltage is able to rise up to the joule thief turn on voltage of about 0.55V.
Power measurements require calculations using the collected data. For that I have imported the data into Python so that I can then calculate power and battery capacity.
convert_to_h5.py uses a modified version of my Windaq Python library to convert the BatteryTest_Rayovac_01.WDH file into a pandas dataframe that is then saved as BatteryTest_Rayovac_01.h5. This will allow faster importing of data into Python for future calculations. Data collected at 1 kHz is too large for conversion to a h5 file, the recorded Windaq file is 2.76GB and causes Python and my computer to crash. I am sure inefficiencies with convert_to_h5.py is preventing importing the data but it is identical to the more reasonably sampled 10 Hz data so there is no need to look at the 1 kHz sampled data file.
Now that the data is imported into a format that Python can understand it is possible to calculate power consumption of the circuit. First step is to calculate power using the collected voltage and current.
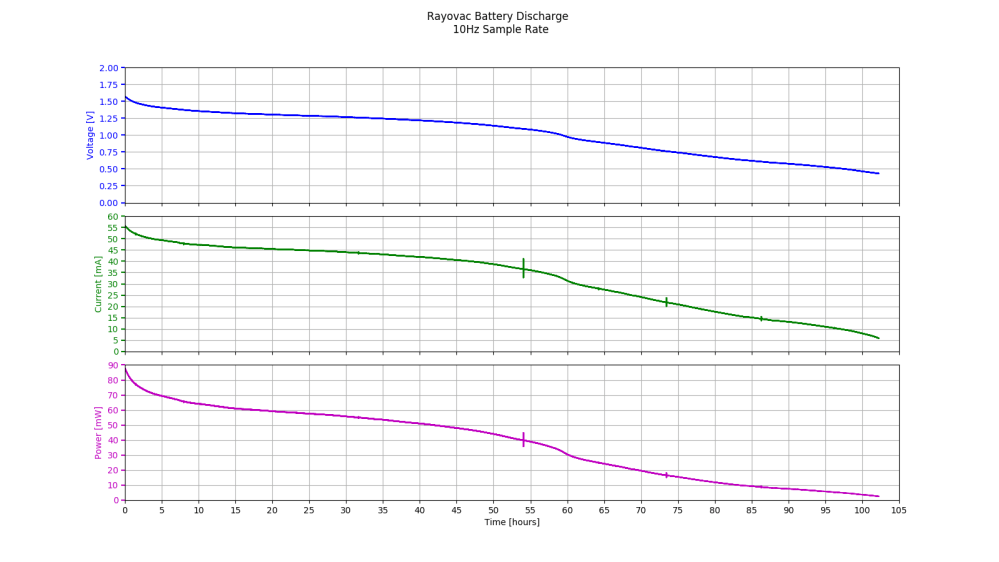
To calculate the battery capacity in Wh integrate the power curve from the plot above. To do this in Python I first found the time interval between samples, dT = 0.10 seconds. Then the integral can be approximated using the cumulative sum of power * dT for every point along the curve. Follow a similar calculation for mAh.
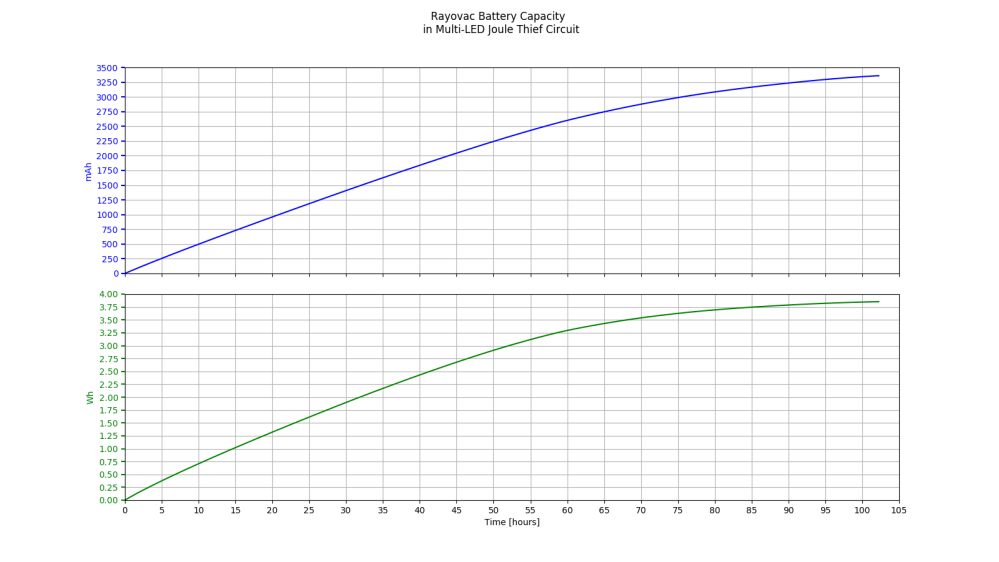
For this circuit the battery capacity is 3.85 Wh or if you prefer 3359mAh.
The Windaq data and Python code used to create the two above plots can be found at the following GitHub repository: https://github.com/sdp8483/JTBatteryLife. Due to GitHub file size limits of 100MB the BatteryTest_Rayovac_01.h5 file could not be uploaded. Run the convert_to_h5.py file to generate BatteryTest_Rayovac_01.h5 locally.
View other related Joule Thief articles.